


How to Read the Volume of a Stock ?
2 minutes read
Learn easy steps to read the volume of a stock and movement of the stock market – A good way of investing in the share market by the beginners especially for the day trading is through Volume analysis. The share market volume analysis indicates how many shares are bought and sold in a day. It will help you to gain which share to buy for intraday or long term.
In general the volume is the number of shares of stock or options or futures traded either daily, weekly or monthly on the various stock exchanges. It also helps in finding the moving average (e.g., 5 days, 20 Days etc.).
Key Highlights :
What is the Volume Analysis in Stocks ?
-
High volume denotes the interest in particular stocks from the large number of participants..
-
High volume indicates an active market; in an active market, the spread between bid and asked prices is usually narrower.
-
High volume also shows the trend about breakout in a trading range. Before a market bottom, investor nervousness leads to panic selling, a characteristic of which is high volume.
-
Strong buyer interest in particular stock.
-
Low volume reflects a lack of confidence that is usually indicative of a consolidation period when prices are within a sideways trading range. It happens generally in falling market.
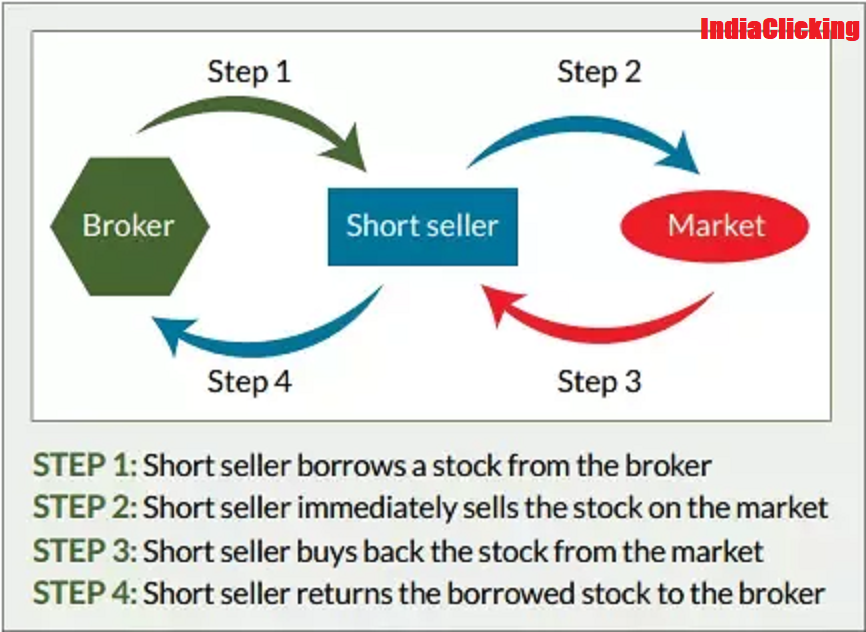
Also Know – What is short position in stock market ?
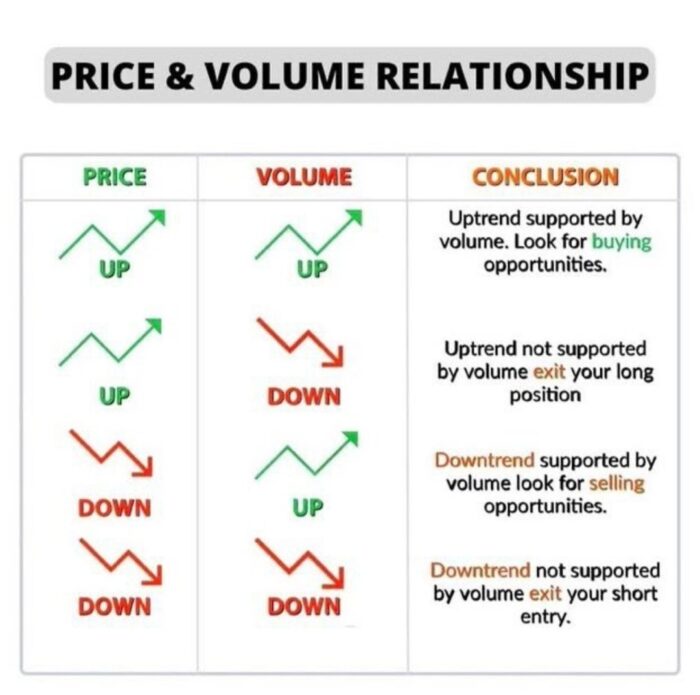
Trends in Stock Volume Analysis
| Volume | Price | Interpretation |
| Increasing | Rising | Bullish |
| Decreasing | Falling | Bullish |
| Increasing | Falling | Bearish |
| Decreasing | Rising | Bearish |
How to Analyze the Volume Trends ?
-
Bullish Stocks – High Volume with a new high price. A new high on lower volume is deemed temporary.
-
Bear Stocks – A new low price with high volume is a bearish indicator. A new low on light volume is less significant.
-
New high price with larger volume but lower activity than the previous rally is always risky. It may point to a coming reversal in trend.
-
A rally on lower volume is questionable. It warns of a possible price reversal.
-
If prices advance after a long decline and then go to a level at or above the previous trough, the indicator is bullish when volume on the secondary trough is less than the first.
-
If the market has been increasing for a while, an anemic price increase coupled with high volume is a bearish sign.
-
After a decline, substantial volume with minor price changes points to accumulation, typically a bullish indicator.

Leave a Comment